tiny lemmy 

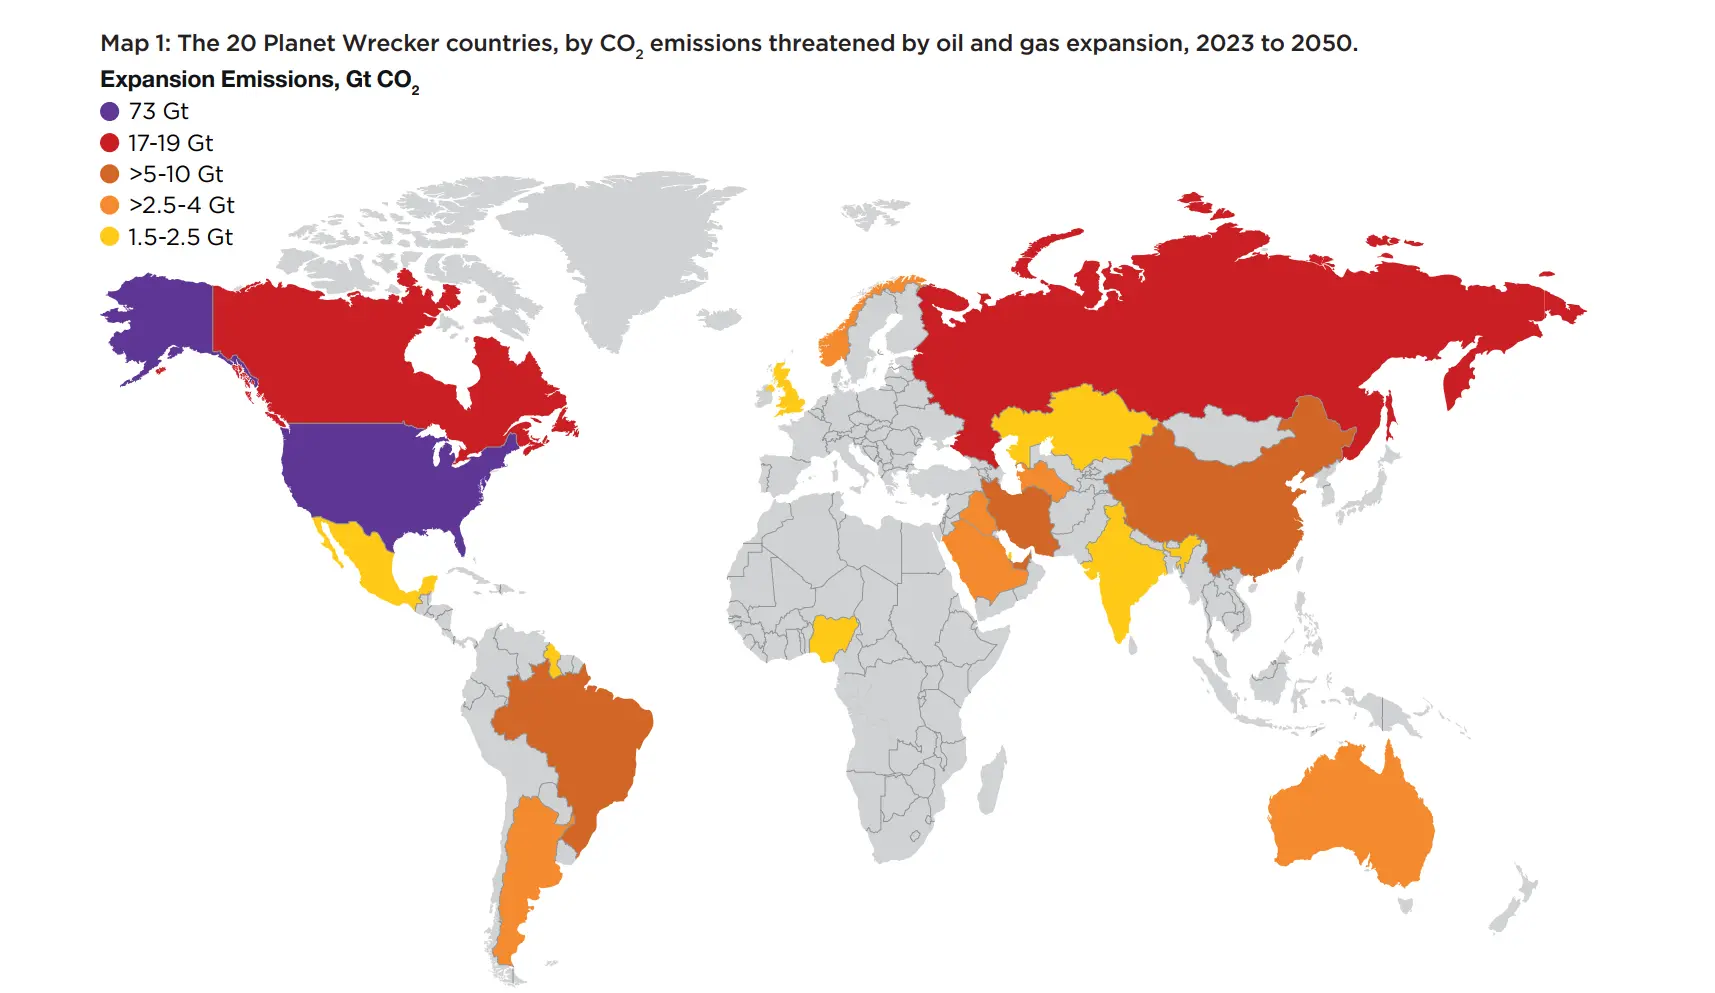
The Top 20 Planet Wrecker Countries by Expansion Emissions 2023 - 2050

c/map_enthusiasts · u/RadioFreeArabia@lemmy.cafe · 63 points
Open external link

source: https://priceofoil.org/2023/09/12/planet-wreckers-how-20-countries-oil-and-gas-extraction-plans-risk-locking-in-climate-chaos/


Comments

u/Specal@lemmy.world · 2 points

A few of the dimwits I work with use china alot as a reason to not do anything about climate change because they keep building coal plants but... The coal plants they build are more efficient.

According to this chart the UK is doing well but we can still do better and we should keep doing more.

u/originalfrozenbanana@lemm.ee · 7 points

Not to mention India and China vs. the US

Total emissions would tell a different story but population is not the only factor here

u/Specal@lemmy.world · 8 points

UK has a higher population than Canada but had a lower rating on this scale. So that's not strictly true.

u/volodya_ilich@lemm.ee · 3 points

China and India have 5 times the population of the USA, and yet are 1 order of magnitude or more below the USA. You're not making sense here

u/benjhm@sopuli.xyz · 2 points

It's about future oil and gas expansion (FOGE), what matters to the atmosphere is the total - identifying potential threat.

Effectively multiplying FOGE by area (as shown) doesn't make sense, but neither does FOGE per capita (as most is exported, not consumed locally). I'd suggest just a sized blob for each country - then can show some other dimension with the color.

u/Skua@kbin.earth · 2 points

They are actually there in the report... but barely. They're much lighter than every other border. It doesn't seem to be mentioned anywhere so I assume it was just a mistake

u/RadioFreeArabia@lemmy.cafe · 3 points

This map is about future oil and gas expansion. You can see the list of countries by past and present coal production here https://en.wikipedia.org/wiki/List_of_countries_by_coal_production

u/Skua@kbin.earth · 14 points

This is obivously not the actual point of the map, but why have a bunch of countries in Central Africa merged? It looks like Angola, both Congos, Gabon, and Equatorial Guinea

u/Cornelius_Wangenheim@lemmy.world · 13 points

Talking about "planet wreckers" but leaving out coal is either incredibly stupid or deceitful. Nevermind that consumption is where the blame should be laid, not production.

u/1rre@discuss.tchncs.de · 3 points

This is so niche... Not current production, not future production, not emissions, just the difference between production now and production later seemingly designed to give the middle east and Venezuela a pass because they're already producing a crazy amount

u/SkyNTP@lemmy.ml · 1 points

It's essentially a map of big countries (population, territory, population density...)

This map would be way more interesting if it was normalized per capita or some other meaningful denominator. Only then does it make sense to point fingers.

u/card797@champserver.net · 0 points

So the consumers of oil are good. Just the producers are bad. This is the boogeyman in map form.